I assume - but maybe I'm wrong - that you are aware of the "Remote Debugger" feature available both for Chrome and Safari. These features give you the ability to use dev tools (Chrome Dev Tools and Safari's version) on your desktop while running a web page on your mobile device. I've only tested this with iOS and Safari so far, but it works great. Not only that, it works just fine with the simulator or a 'real' device connected via USB.
What you may not be aware of is that this also works with PhoneGap applications! To be clear, this means you can use your browser's developer tools to see console messages, view and modify the DOM, check network requests, view local and session storage, and add JavaScript breakpoints.
Just to be clear on that last point - you can use a fraking step debugger with your PhoneGap applications.
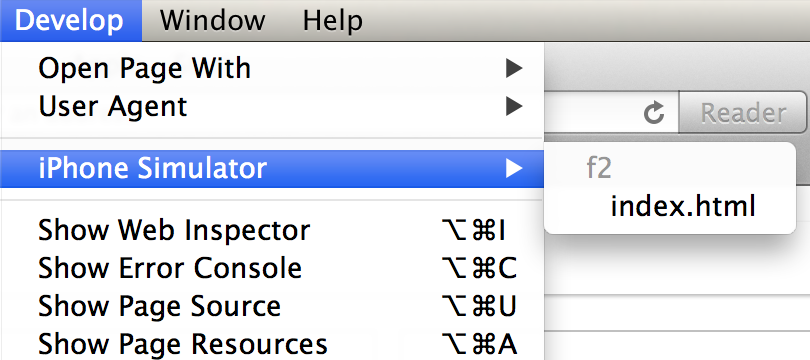
In order to use this feature you must be using iOS6, but even if you are targeting iOS5, you could easily use iOS6 in your simulator just for debugging purposes. You must first enable the feature, but once you do, just open Safari (because, seriously, you don't use it for the web, right?) and look under the "Develop" menu:

In the screen shot above, I'm referencing a PhoneGap application called "f2" (sorry for the short, simple name) on my iOS Simulator.
There is one small annoying issue with this feature. Whenever you close and restart your PhoneGap app the debug window wil close. That means any console messages you may have in the "deviceready" handler will probably be missed. The debug tool only shows messages received after you started the the debugger. If you have something going wrong in that area, you may want to move the code out into a secondary function started by a mouse click or some such.
Anyway, to make this a bit more clear (hopefully), I did a quick video demo showing the feature. If not pre-selected, I'd suggest switching to the HD version so the details are a bit crisper.