A look at New Relic Browser
While at Fluent Conf this year, I was walking by the New Relic booth when I noticed something interesting - a product called New Relic Browser. Back when I converted my blog to Wordpress, I ran into a lot of problems. My server went down, WordPress crashed, it was a bit frustrating. (Much like how lemonade in a paper cut is a bit frustrating.) One of the tools I used to help diagnose my server was the New Relic Server monitor. Outside of a few issues installing, I was really impressed with the level of detail the monitor provided. While it wasn't the final solution for fixing my problem, it definitely helped me pinpoint what was sucking up all the RAM on my box, and helped me check my changes to ensure things were going well. Best of all, this was entirely free. I'll give them huge props for offering such a powerful tool for no up front money. Because I had such a good experience with them on the server side, I thought I'd give their Browser product a try as well.
As you can guess, this tool is meant to help you gain insights into how well your web application is performing. I decided to try it on my blog, which, admittedly, is probably not the best use case for this product. WordPress isn't something I need to hack up and outside of the performance issues I had on the server side, I figured the client side was pretty much good enough. It certainly seemed good enough to me. But at the same time, my blog gets quite a bit of traffic so I figured it would also provide a good set of data to dig into as well.
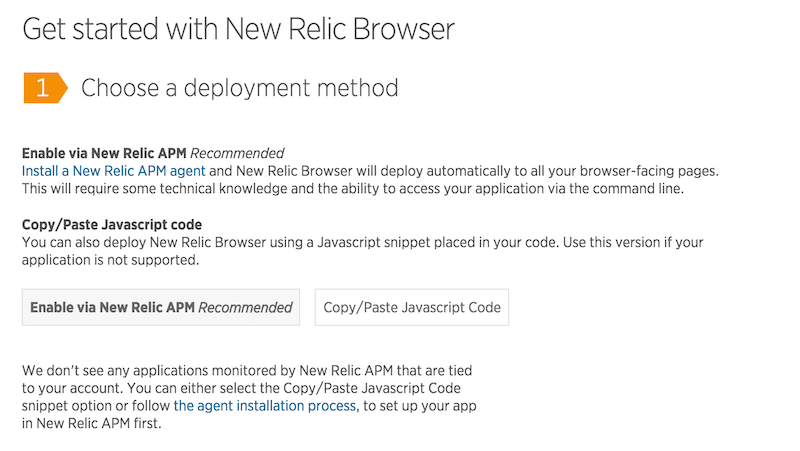
Setup is relatively simple. You begin by selecting a deployment method:
I selected Copy/Paste as I figured that would be simpler. On the next page, I said I was not using APM, even though I guess I kinda was. I was trying to test this as someone who was not also using the server side product, so there may be things I missed out on. Typically when I try products like this though I try to keep things as simple as possible.
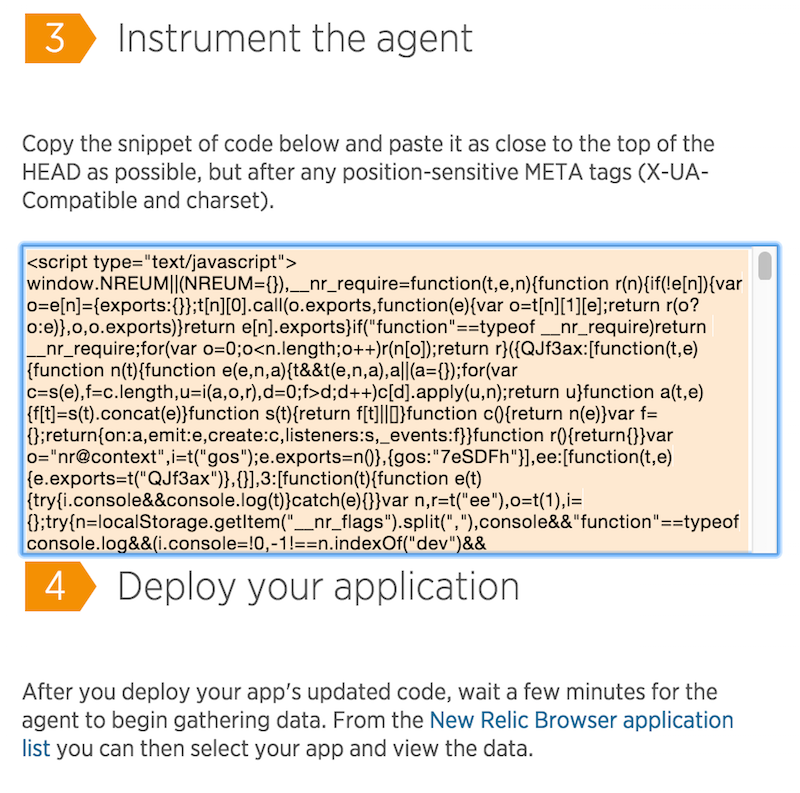
The final step was copying a ginormous JavaScript string into my WordPress template.
So that was that. I copied in the code, cleared my WordPress cache, and then promptly forgot about it for a week or so. I then took a look back at my stats. There's a tremendous amount of information you get right on the front dashboard.
First off - note the browser load times. I'm averaging 6.8 seconds or so which is quite high and not what I expected. For over ten years I ran my blog with very precise knowledge of what I had going on within my templates. With WordPress, I've kinda gotten lazy about it and have given up being so deeply involved. This gives me a clue that maybe I need to take a closer look at my template and plugins and see if I need everything I've got.
Also note the error graph. On average, 2% of my pages have JavaScript errors. The real question is - how often do those JavaScript errors impact the core thing people need to do on my site - read a blog post.
As I said, the dashboard is pretty packed, but let's go deeper. First, the Page views report.
This report shows recent pages and which page requests are consuming the most load time. You can mouse over each line item for a detailed view:
You can also switch the "Sort by" to show average page load time:
And yes - that twenty plus second item on top there made me crap my pants. Honestly I'm not sure why that page averaged so high as it is relatively simple, but it does give me something to dig into deeper.
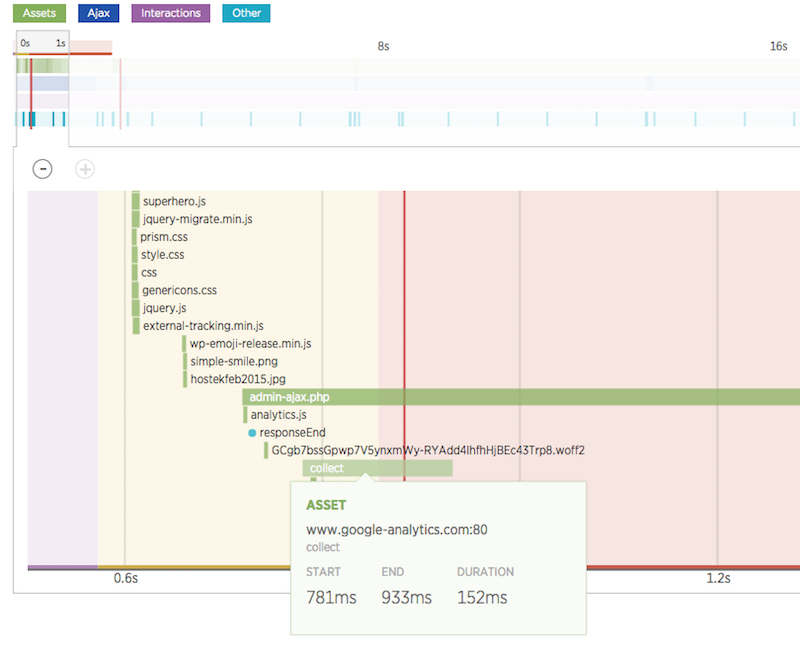
The next link, Session traces, is not what you may think. I had assumed this was a report of a 'session' for one visitor to my blog. Instead, it is a deep look at one particular web page. And when I say deep, I mean deep. Here is a top level report for one session:
Note all the detail in the chart. You can then scroll through the session and look at every particular darn thing in the one request. For example, here I can look at what Google Analytics is doing.
The next report shows you the AJAX requests your web app is making. You get details on what is making requests as well as throughput and data size. I can say from experience that the data size chart could be really useful. Back when I first learned Ajax I made the mistake of not considering the size of my packets and my applications suffered through it. This is a rather long page so I've split the screen shot into two parts.
I'm thinking that in 'real' web app the Ajax report will be the number one place you'll find nuggets of information. Of similar importance is the JS errors report.
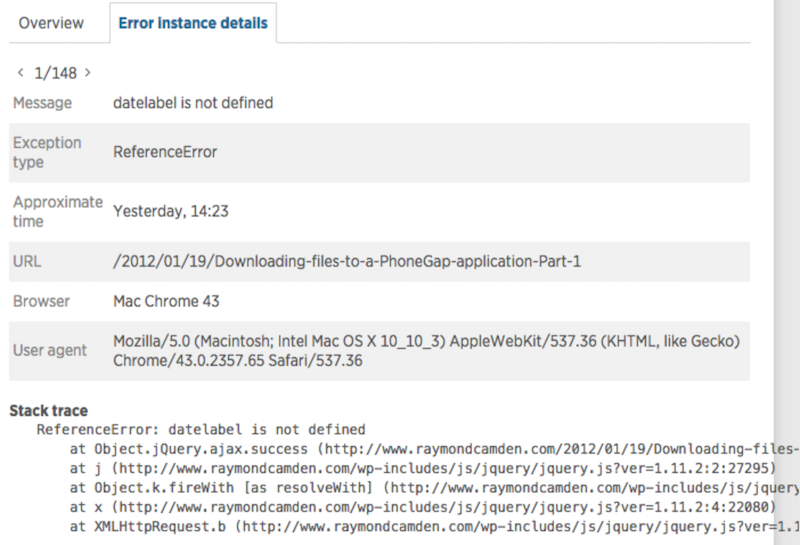
Clicking on a particular item will give you details:
If you click on the instance details, you can see the line number where this error was thrown.
While not this particular error, earlier I found an issue with Gravatar. I didn't think I was using Gravatar, but it turned out one plugin was making use of it and throwing an error. I modified the plugin and the error went away.
The Browsers report gives you details about what types of browsers are hitting your site and how well they perform. I mentioned how I was a bit surprised by the page load times on my site, well in this report I can see what browsers are having the worst issues with page load:
Look at that jump for IE and Opera! That's fascinating to me. It doesn't necessarily mean those are bad browsers, but it gives me an area to focus in if I were to start digging into my site performance.
You can then go to the Geo report to see how different areas of the world (and America) handle your site.
Along with just reporting, you can also create alerts too. You get a default alert policy out of the box and can define your own as well. This is fairly similar to what you get in the server product as well.
From what I can see, this is a really darn good tool, and as I said, I had great success with the server tool. So how much does it cost? Here is the price plans as of the time I wrote the post:
150 a month isn't necessarily cheap, but heck, that's my rate for development (yes, that's what I charge by the hour) and considering how much data you get the forensic information is easily worth it. The free (Lite) version also has fewer reports. If you go to their pricing page you can see what you don't get at that tier, but note that you get 14 days of free access to the top tier to see if it is worth it.


