A few weeks back, Rebecca Murphey tweeted out a link to a survey she was running involving how people learn JavaScript and how it has impacted their careers.
Have you worked on getting better at JS in the last year? I’d love your input https://t.co/qEGaIWW6ha I’ll share what I’ve learned soon!
— Rebecca Murphey (@rmurphey) January 12, 2016More recently she shared the raw results as a CSV dump and I thought it would be fun to parse the results. I was genuinely interested in the data and I thought it would give me a chance to play with a JavaScript charting engine. I've taken a stab at rendering the data and I thought I'd share the results. I'll link to the demo at the end, and please note that any mistakes are entirely on my end, and not Rebecca's fault.
I began by looking into CSV parsing with JavaScript. A quick search turned up PapaParse which has an incredibly simple API. Here's what I had to do to parse the data.
Papa.parse("./learning-js.csv", {
	download:true,
	header:true,
	complete:function(results) {
		allData = results.data;
		doCharts();
	}
});
That's pretty darn simple. PapaParse has quite a few options so I definitely recommend checking it out.
I then looked into charting the results. I began with Chart.js which was pretty and easy to use, but I couldn't figure out how to make the pie chart labels show up all the time and not just on mouse over. I found a workaround, but honestly, it just kind of bugged me that I couldn't do it easier so I punted and went over to Chartist.js. Personally it was the mascot that sold me.

The API was a bit weird in places, but I was able to get some basic charts written out. I thought the engine made some odd choices for colors. For example, a two-slice pie chart would use a red and then a near-red color. You could distinguish the slices, but they were pretty close. You can tweak the colors of course, but the defaults for the pie chart seemed odd in my opinion.
Anyway, here are the questions and results, taken out of my ugly demo app and positioned a bit nicer.
Have you focused specifically on improving your JS skills at any time in the last year?

Absolutely no surprise here.
Which resources did you use to help you learn?

Kinda surprised how high blogs rank here, especially since blogs seem to be better for one offs, like, "How do I do cowbell in X", versus more broad training. Then again, maybe people need more concrete examples versus learning JavaScript at a broad level.
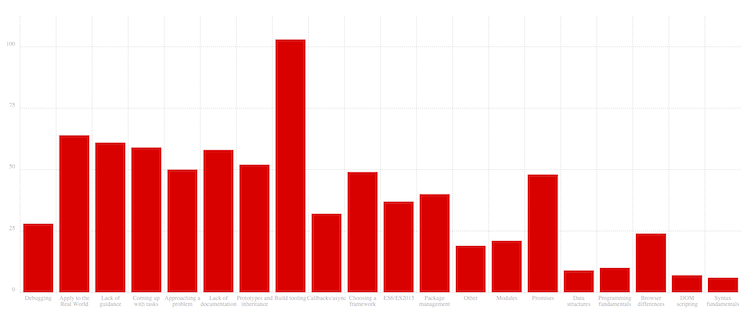
During your learning, which areas have been particularly challenging?
Just an FYI, I skipped a few question. Anyway, the chart. And I apologize, this is a big one.

The labels are pretty much unreadable there. You can find a larger version here. Again, just click for the "full" view. Top three issues were:
- Build tools
- Understanding how to apply things to the real world
- Lack of mentoring/guidance
Number two in that list is a particular pet peeve of mine. I've seen far too many examples that are so far removed from reality that they are near useless. (And to be fair, I've done it myself.)
Which technologies do you use in your current role?

Again, no real surprises here, although I would have thought Node would have been higher. I apologize for the clunkiness of some of the labels.
How long have you been working professionally in web development?

Woot - I'm not the only old person in tech! I'm squarely in the 10+ years bar there. I began working with the web around 1994 or so.
How would you rate the improvement of your JS skills in the last year?

This is a good chart. Well, not my design - I don't like the lack of space. What I mean is - it looks like most people are improving, and improving at least a little bit. Hey, you don't have to go from noob to demigod in one year. Baby steps is just fine.
Have you gotten a new job, a promotion, or new responsibilities since improving your JS skills?

I'd say that's a damn good chart too.
The full report
Ok, I should clarify - this isn't a full report - I didn't chart the questions focused on the one resource that was best/worst. But you can view everything here: https://static.raymondcamden.com/rmurphey/
Please - for the love of God - do not view source. Seriously. I'm not being humble. This is absolute crap code. Thanks again to Rebecca Murphey for creating this survey. I'd strongly recommend checking out her js-assessment project as well.