DevTools Tips for Progressive Web Apps
As this month is apparently "blog everything I can about PWA month", I wanted to share some quick notes on how I'm using DevTools, specifically Chrome (but I'll quickly look at Edge, Firefox, and Safari) to work with and debug progressive web apps (PWAs). To be clear, this will not cover every aspect of DevTools related to PWAs, but rather focus on what's been helpful to me so far.
Starting Off
First off - I generally stick to the "mainline" Chrome (released Chrome) as I prefer to use what regular people use. (Well, most devs.) That being said, Google Canary is making some improvements to DevTools in the PWA area. While I was testing last time, I found myself going back and forth a bit. Don't forget you can run both at the same time. At the time I'm writing this article, it looks like the biggest differences are that Canary lets you test background sync and push which is pretty good. I'm not using those features yet, but I can see being able to test them in the browser like that as being very helpful.
Next - probably the biggest tip I can give is where you'll find PWA related tooling - under the Application tab.

Probably obvious, but I remember having trouble finding it the first time. Also note that there is where you'll find tooling related to client-side storage, including Local Storage, Session Storage, IndexedDB, Web SQL, and Cookies.
Also note that Chrome lets you rearrange the tabs so your order may not match what you see in the screen shot above.
App Manifest
The first tool I think you'll find useful is the app manifest viewer. As you can probably guess, it will report on what settings you've specified in your app manifest along with providing a link to view it. Here's mine for my NMS Tracker PWA:
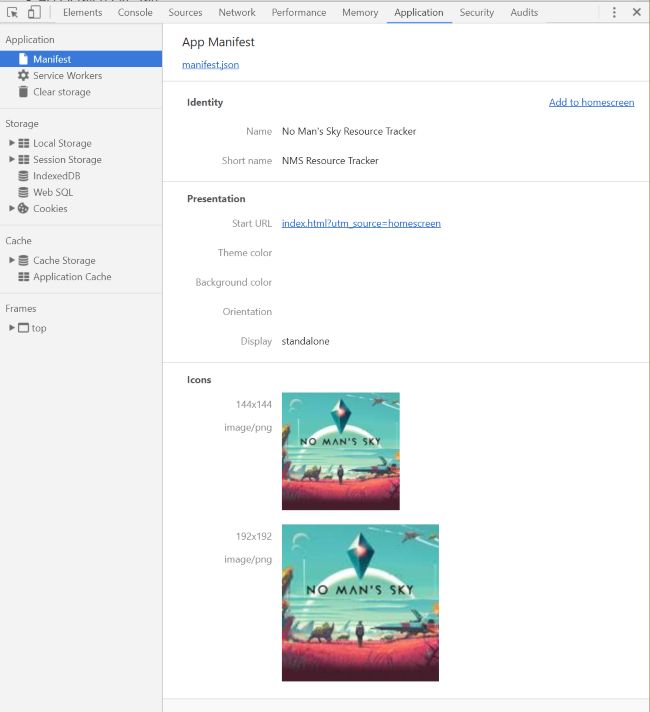
For the most part this should be pretty self-explanatory. I love that it displays the icons and that start_url is clickable. If you're doing anything special when a site is launched via the homescreen, this makes it easy to test.
Pay special attention to the "Add to homescreen" link. This lets you test Web App Install Banners which are an automatic prompt by Chrome to install your app to the homescreen. (Note, this also works on desktop too.) Clicking this link will have the browser check to see if you're app meets the criteria for this feature. It does not actually start the process. Instead, you'll need to reload the page in order to get the prompt, again, if you've "passed the test."
Speaking of that, if you are missing something, you'll get a nice error in the console:
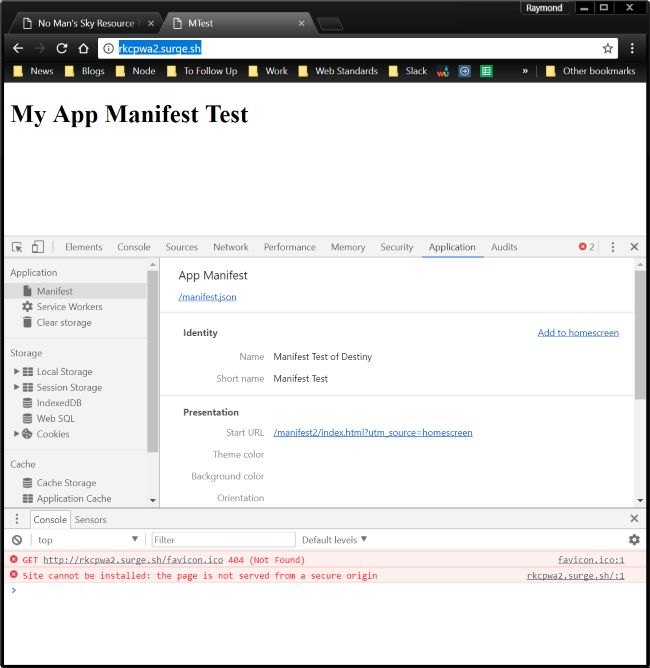
See how the error is clearly telling you what you are missing? This is really helpful. Note though that it only reports one issue at a time. If I fix the issue above and try again, I get a new error:

Basically you have to correct one issue at a time (if you don't know what you need that is). When you do get it working, again, note that you have to reload the browser to get the prompt to trigger. Here's how it looks on desktop:
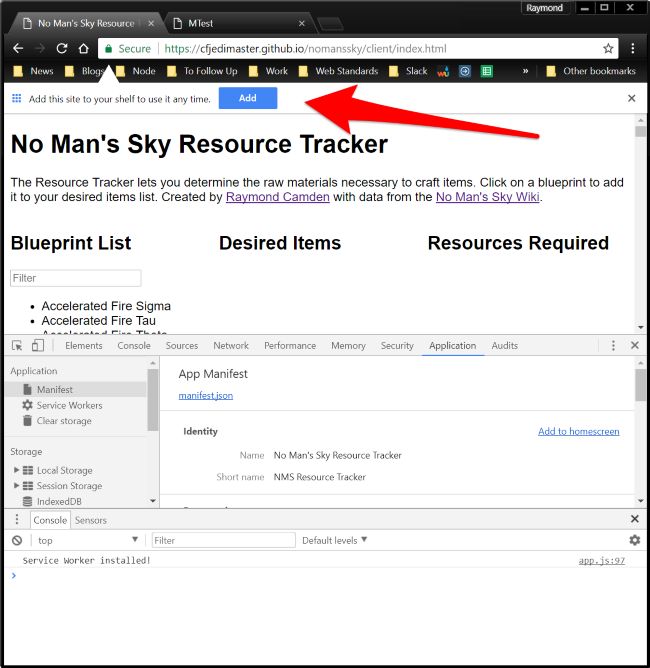
As a reminder, even if you "fail" the "Add to Hoemscreen" test, do not forget a user can still manually add your site to their homescreen.
Service Worker Debugging
The next useful tool will be the "Service Workers" section of the Application tab.

In the shot above, you can see the status of my service workers. Remember that your service worker has a "life cycle" which impacts when it actually impacts your page. To make things easier, you absolutely want to enable the "Update on reload" checkbox as I've done here. Just don't forget that for regular users, they will get the expected behavior in terms of the service worker life cycle.
This is also where I've seen errors in service workers reported - and also where I've had problems. I'll see random errors here sometimes that almost seem as if they are gremlins in the tooling as everything seems fine on the page. This is where I typically switch over to Canary as it seems to be more stable. I know that's a bit vague and I apologize, but there ya go.
Caching
The next tool you'll want to check out is Cache, and specifically Cache Storage. This screen shot is from Canary which has made a few changes compared to mainline.
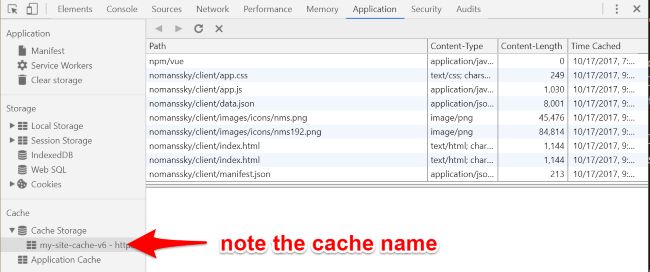
Notice I've called out the cache name in the screen shot. If you've changed this and don't see it reflected, you can right click on the Cache Storage node and force a refresh. Also note that you can click on individual items in the cache to see what is there. Service workers give you 100% control over the cache so even if you see a URL there where you think you know the contents, it's entirely possible an older version, or even a modified version, is in the cache. You can also right click on individual items to delete.
Lighthouse
Ok, so I already covered this last week, but under the Audits screen you will find the Lighthouse tool:
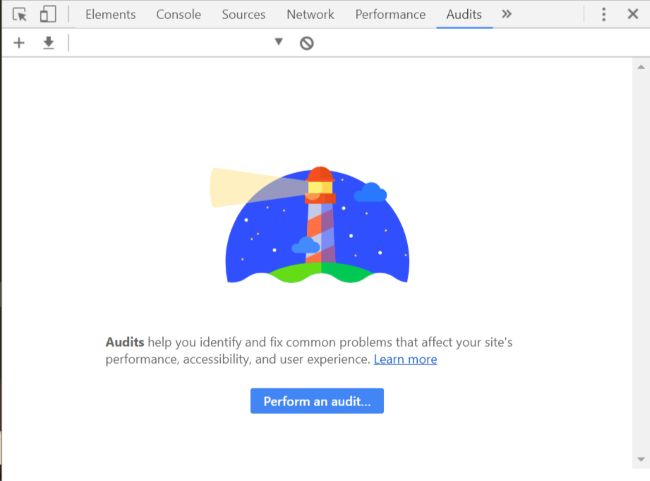
You can select the following audits:
- Progressive Web App
- Performance
- Best practices
- Accessibility
I've run into issues sometimes with this tool and it was suggested to me (sorry, I forget who said this) that I run them with extensions disabled. I haven't had that problem lately, but if you do, try that to see if it helps.
When done - you get a very nice and detailed report:
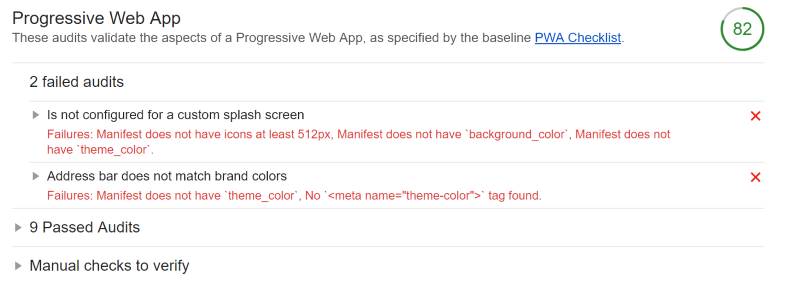
Ok, now a quick check of other browsers...
Firefox
As of the time I wrote this entry, Firefox was on version 56. Supported tools I found were:
- A Cache Storage browser. It does not let you inspect the contents of each item in the cache though.
And that's it. Looks pretty minimal so far. To be clear, my service worker and everything else worked, but the tooling support seems to be a bit behind Chrome here. (Just in this area though, in general, Firefox's devtools are pretty bad ass.) I also checked the Developer Edition and didn't notice anything different.
Microsoft Edge
No support at all yet so there's nothing to even check in their devtools, however, Microsoft has publicly committed to supporting service workers and related PWA tech so it's only a matter of time. (And I'd bet it will be soon.) You can track support for it, and other APIs, here: https://developer.microsoft.com/en-us/microsoft-edge/platform/status/serviceworker/
Safari
Safari definitely doesn't support service workers or even an app manifest so - why bother checking. Apple has said they are investigating it, and the good news is that when, and if (sorry, I won't believe it till I see it and even then, I'll remember how they shipping IndexedDB support) it is supported a vast majority of iOS users will get it very quickly.
The Movie Version
I whipped up a quick video showing the stuff I described above. Let me know if it helps!